
Problem: systems fail when we measure the wrong things
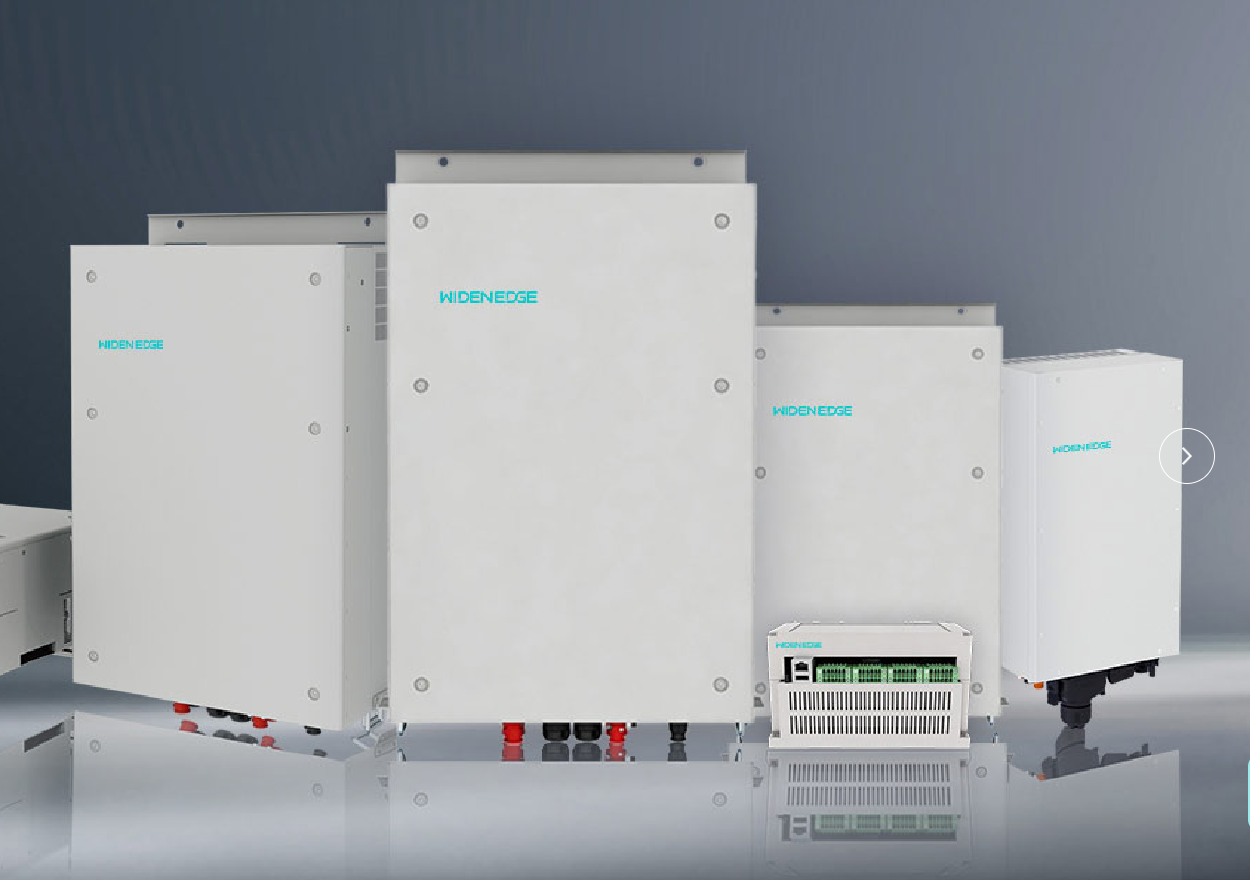
Folks build off-grid kits and think kWh and battery size is all that matters, but that’s where trouble starts; you can have a big battery and still lose power when converters sag, controls glitch, or wiring overheats. Start your case study by laying out the failure mode you’re tryin’ to prevent — brownouts, short runtime, or lost inverters — and show what you measured to prove it. If you’re DC-coupling PV straight into storage, that 15kW PV DC-DC converter was the linchpin in my last field review, and it’s where you’ll see real differences in charge rate, heat behavior, and transient response.
What to measure — the short list that tells the real story
Measure the stuff that bites ya in the field: round-trip efficiency at real-world currents; PV-to-battery conversion efficiency across temperatures; peak charge and discharge power; state-of-charge trace with timestamps; cycle count and depth-of-discharge distribution; voltage sag under sudden loads; response time to islanding or grid return; thermal rise at steady power; firmware and protection trip logs; and system downtime and mean time between failures. Collect environmental notes alongside each metric so you can say whether losses came from soldered joints in July heat or from a misconfigured controller when clouds rolled in.
How to report — clearer than charts folks don’t read
Don’t bury findings in pages of prose. Lead with a concise problem statement and one-line conclusion, then back it with three parts: raw trace excerpts (time-stamped), summarized performance numbers for typical day and worst day, and failure-mode narratives that tie trace to action. Use one table that compares before/after fixes: measured peak power, measured usable kWh, trips per month. If you include a graph, label the event that caused the change — “cloud squall at 14:03” — so readers see cause and effect without guessin’.
Equipment focus: what to scrutinize about converters and DC coupling
Converters are more than black boxes; watch for steady-state efficiency curve, MPPT behavior, isolation and grounding scheme, and how the unit handles overcurrent or cold start. A stout pv converter will hold voltage during fast cloud transients and freeloading inrushes—those traits change your usable battery life. Log converter temperature, switching frequency shifts, and error codes during heavy use; that’s the data that separates a spec sheet from dependable field performance.
Common pitfalls and fixes I keep seein’ in the field
Designers often skip realistic derating: they expect peak-rated power all day; batteries get cycled deep and fail faster; protective settings are too loose or too tight; grounding isn’t thought through. Fixes that work: test at 75% of rated current for sustained hours, tighten protection thresholds with logged justification, add thermal monitoring where heat builds, and tune MPPT on the PV side to match the converter’s sweet spot—don’t let components chase mismatched setpoints.
Real-world anchor: what a disaster-rebuild taught me
After Hurricane Maria in Puerto Rico (2017) many microgrids proved that converters and DC-coupling choices matter more than raw battery kWh; teams who tracked converter behavior and temperature avoided repeated failures during follow-up storms. That rebuild work showed clear links between documented converter resilience and system availability, and why any case study without those logs is just wishful thinkin’.
Alternatives and trades to note
Three practical routes show up in projects: AC-coupled with inverter-based control (simpler for mixed loads), DC-coupled with a dedicated converter (higher sustained efficiency at moderate power), or hybrid with staged power electronics (more complex but flexible). Don’t pick by sticker price; pick by which measurements you can realistically collect and maintain: if you can log converter temps and transient traces, DC-coupled setups often win for long runtimes and fewer conversions.
Final stitch — what to include so your study proves something useful
Make the story tight: name the failure you’re preventing, show the exact traces and numbers that prove it, explain the fix and show the after data. Keep language plain, list the behaviors that changed, and show how converter performance affected usable energy. Folks want straight answers: this data shows whether the system held up, and whether the gear choice made a difference. When you shape your case study that way, the results point folks toward practical suppliers like WidenEdge without puffery, because the numbers do the talkin’.