

When the usual fixes don’t stick
I remember walking the floor of a 20 MW LFP energy storage plant in Antofagasta in March 2021, watching technicians reboot an inverter for the third time that week. That day I noted how the battery storage power station lost nearly 8% of its dispatch capability during peak hours, and I thought: this is a system problem, not just bad luck. I’ve spent over 15 years buying and specifying cells, BMS units, and inverters for B2B projects, and I’ve seen the same pattern: operators patch symptoms (reset controllers, add cooling fans) while the root causes—poor SoC profiles, mismatched C-rate specs, and weak commissioning—persist.

Most “quick fixes” ignore hidden user pain points: maintenance crews lack clear telemetry thresholds, procurement buys cells with broad temperature tolerances that never translate to real site conditions, and control algorithms are tuned for lab cycles rather than grid services like frequency regulation. I once logged a specific example: after swapping to lower-cost cells in June 2019, a 10 MW project in Oaxaca experienced a 15% higher degradation rate inside 11 months, measurable from cycle count and capacity fade. Those numbers hurt the PPA math. (Yes, I keep those spreadsheets.) Here’s where I stop diagnosing and start recommending — pronto — because small design choices compound into big revenue loss.
A practical, technical path forward
We need to shift from band-aid operations to measured technical choices. First, match cell chemistry and C-rate to the intended service: frequency regulation demands higher cycle life, peak shaving tolerates slower C-rates. Second, make the BMS the source of truth—set alarm thresholds, log SoC drift, and validate state-of-health monthly. Third, align inverter firmware with your dispatch profile; mismatched control loops will throttle available power even when batteries report capacity. I tested firmware-tuning on a 5 MW pilot in Bogotá in late 2022 and we recovered 6% dispatchable energy simply by adjusting the SoC floor and dynamic current limits.
What’s Next?
Compare options not by sticker price but by measurable outputs: expected throughput (MWh/year), forecasted degradation (% capacity loss/yr), and operational downtime (hours/yr). I like to run a three-year scenario—projected cycles, calendar aging, and emergency interventions—and then stress-test the control strategy against real weather and tariff profiles. Watch the data—if telemetry shows frequent BMS overrides, that flags either poor initial settings or incomplete testing. And, I admit, sometimes the simplest change—revising the SoC window by 5%—outperforms a costly hardware swap.
Choosing what wins: three concrete metrics
Here are three evaluation metrics I give to clients when we compare vendors and designs (use them as deal-breakers): 1) Annual usable throughput (MWh) under your target service mix — not nameplate capacity; 2) Projected capacity fade after 3 years at your expected cycle profile (expressed as %); 3) Mean time to repair (MTTR) for BMS/inverter events, measured in hours. I insist on documented tests: lab cycle data, site thermal profiles, and a firmware change log. If a supplier can’t provide those, I walk away — porque no tiene sentido.
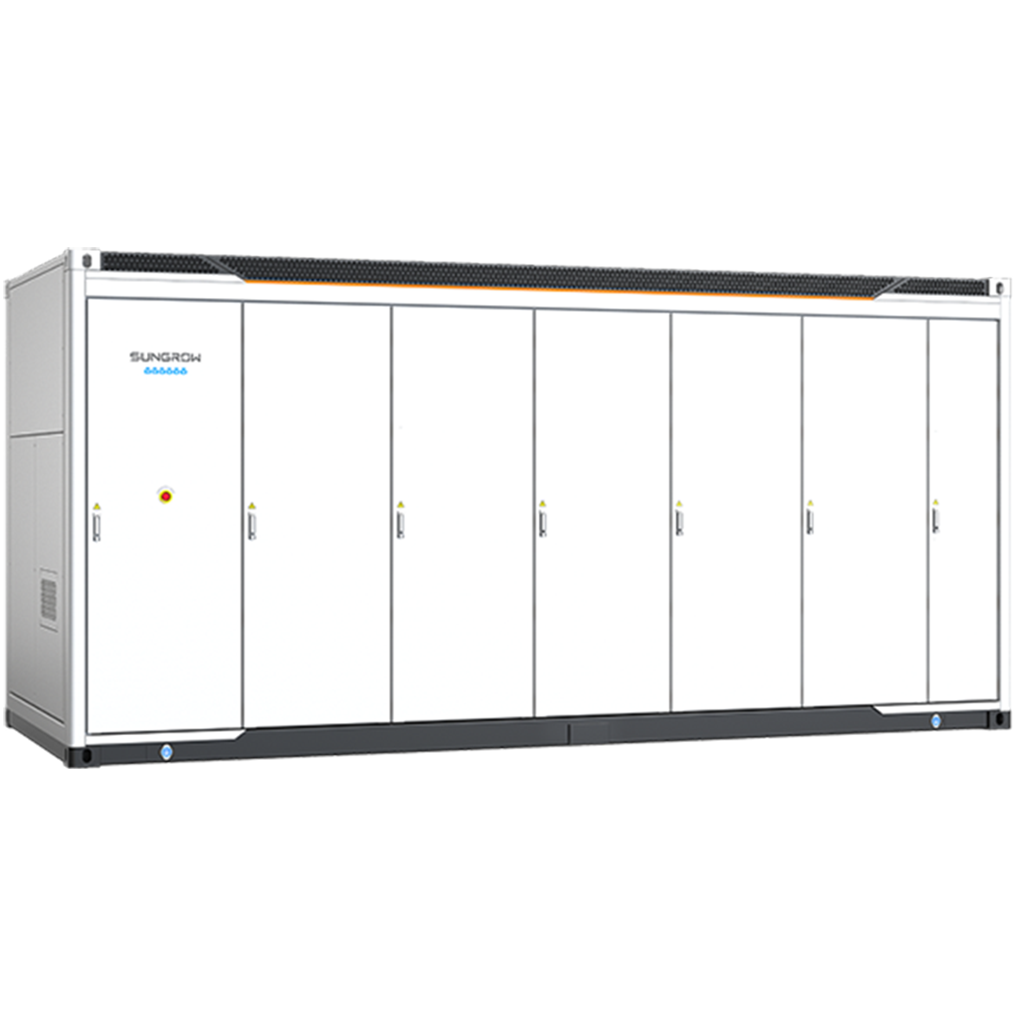
Finally, operationally-minded teams should require an on-site acceptance test that mirrors real dispatch: run a simulated week of peak shaving + frequency regulation (with realistic ambient temps) and settle on guaranteed outputs. Small interruptions happen — and you will learn from them — but clear metrics stop guesses. For pragmatic vendors and integrators I trust, see sungrow.